CFactory — the cockpit tour
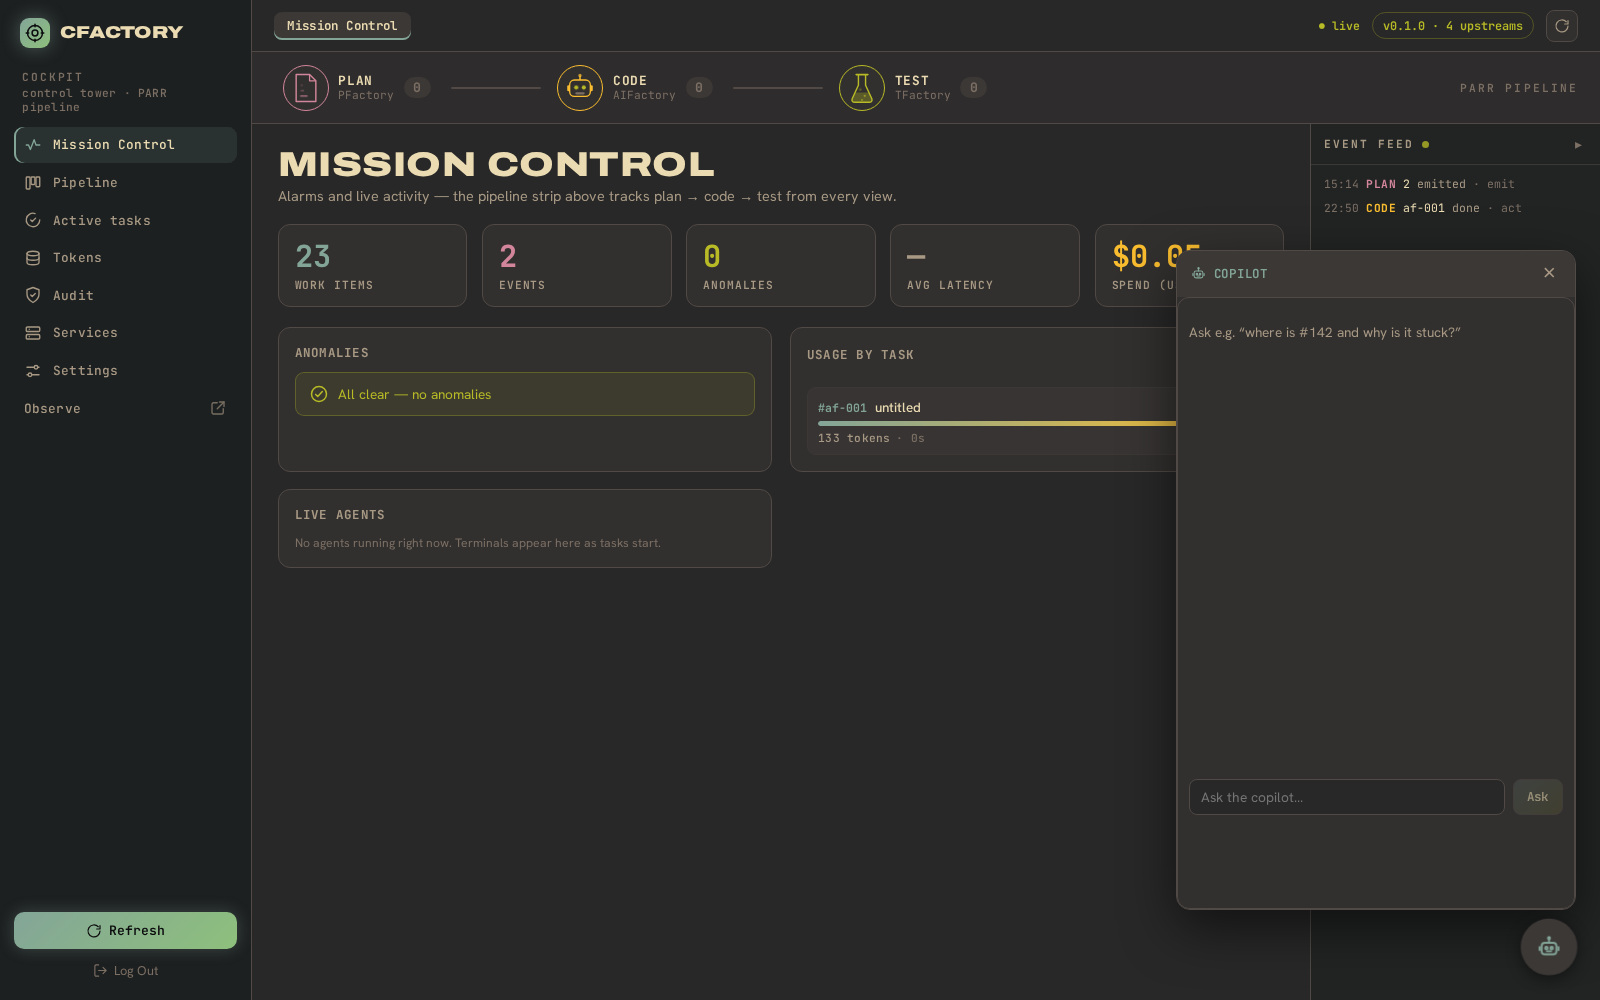
CFactory is the control tower over the whole suite. It threads every unit of work across
PFactory → AIFactory → TFactory into one WorkItem — keyed by the GitHub issue — and puts
it on a single live cockpit, with an agentic copilot and an HMAC-chained audit trail. Here’s
the cockpit, tab by tab.
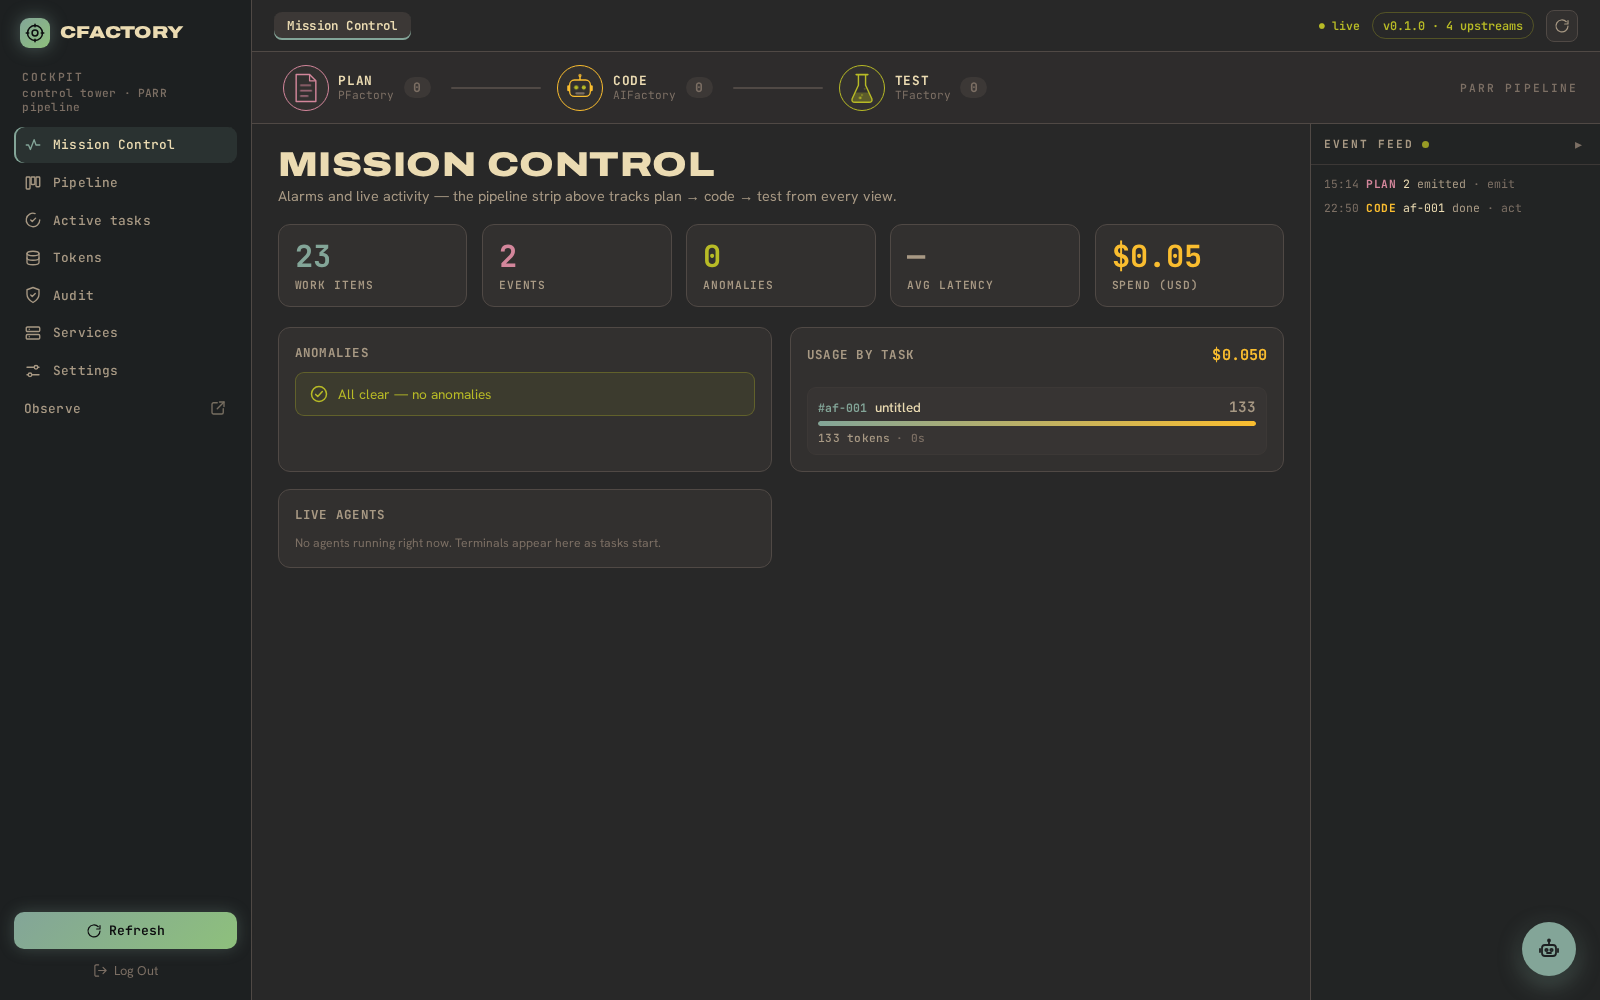
One pane of glass
The cockpit reads the three upstream services in real time — work-item counts at each PARR stage, a live agent roster, and an anomaly feed — so you always know where every feature is.
Steer, with a human in the loop
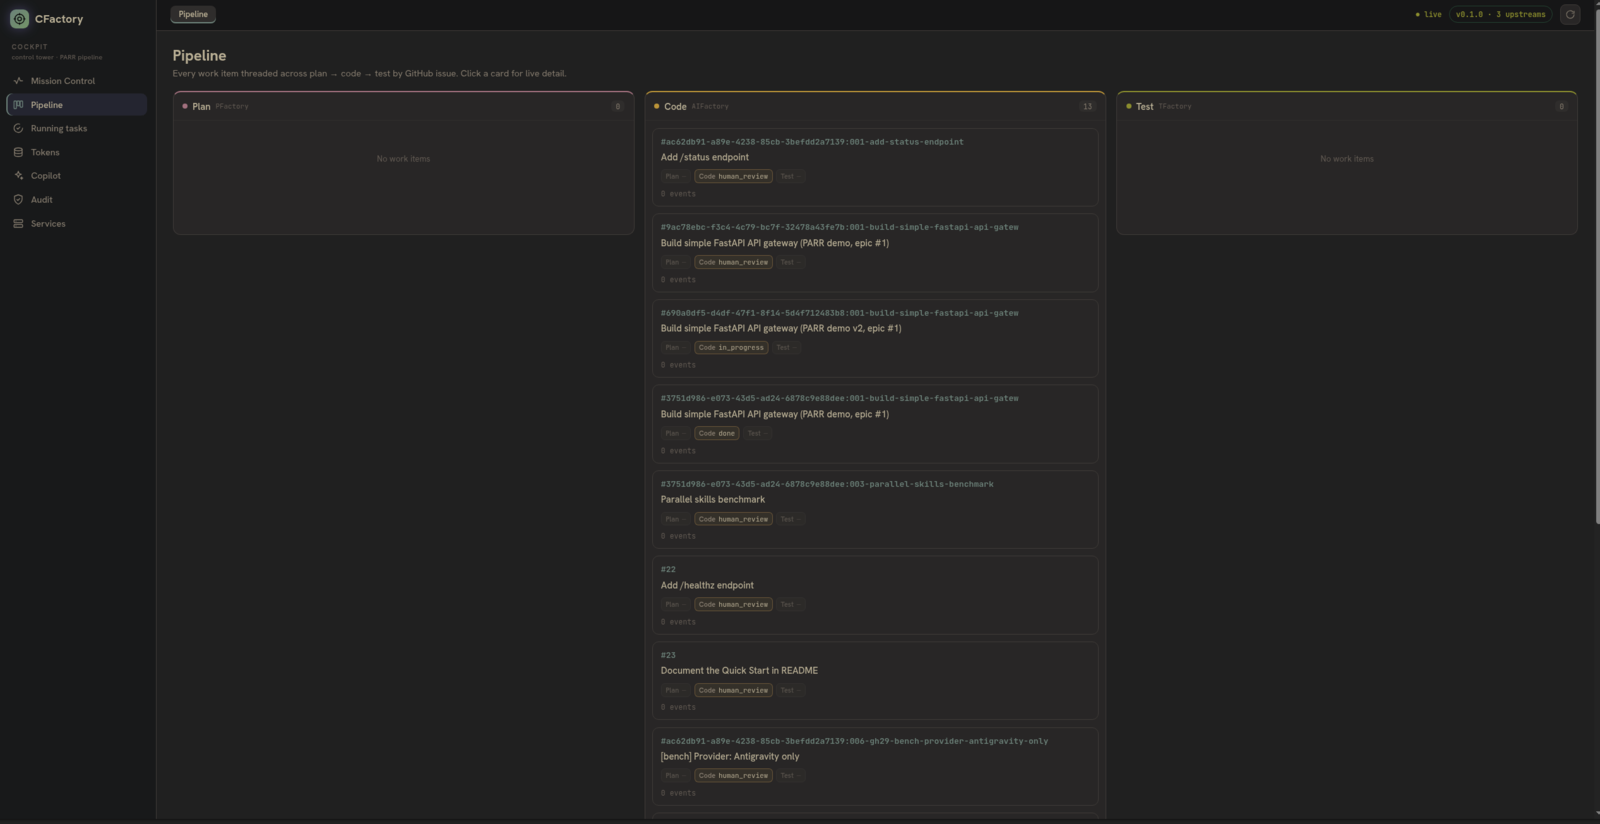
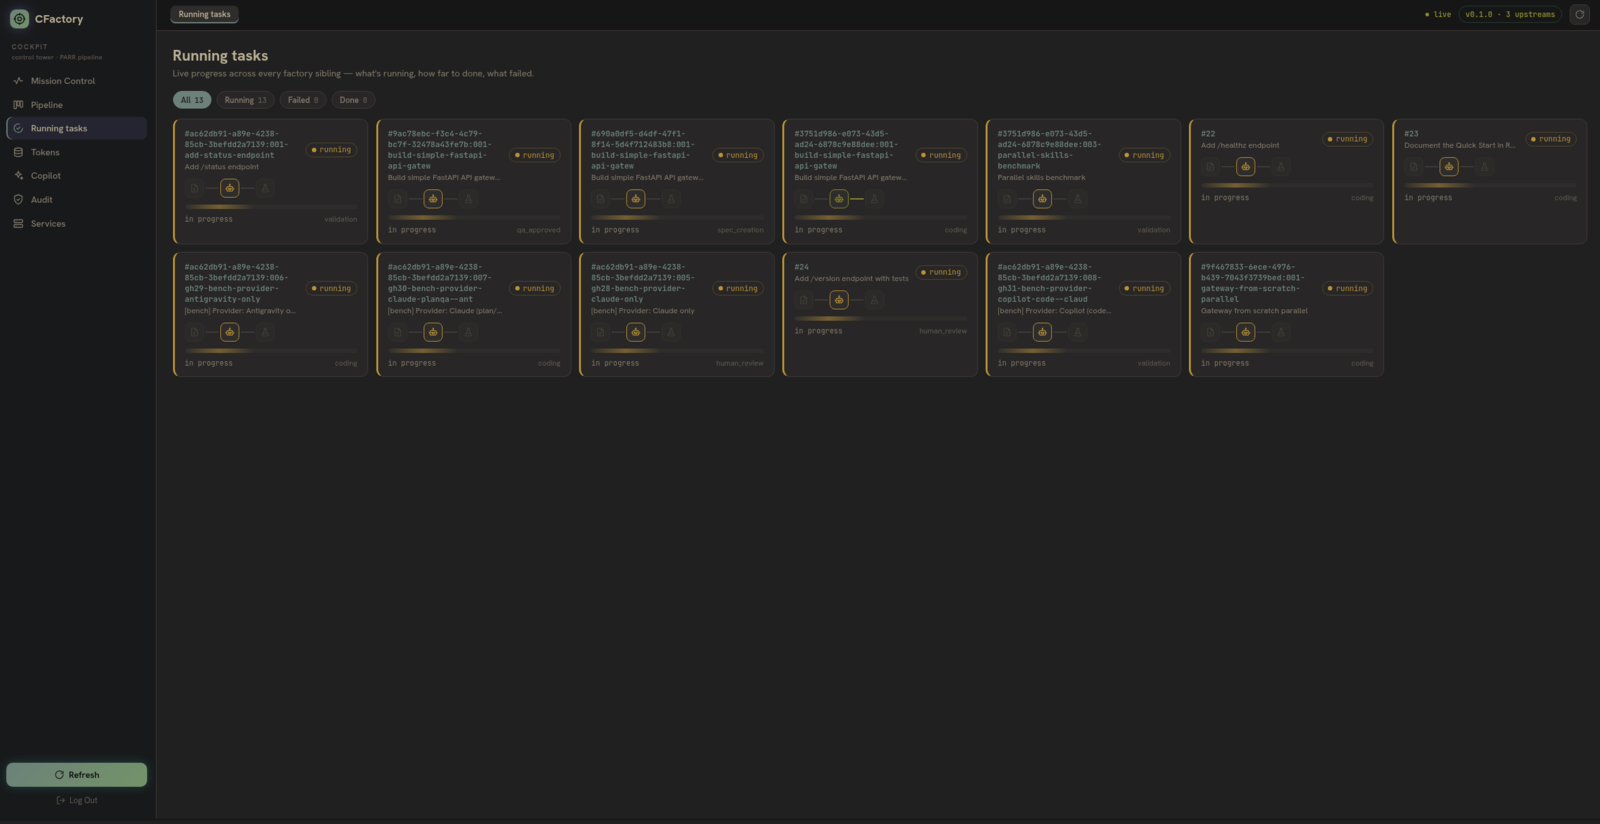
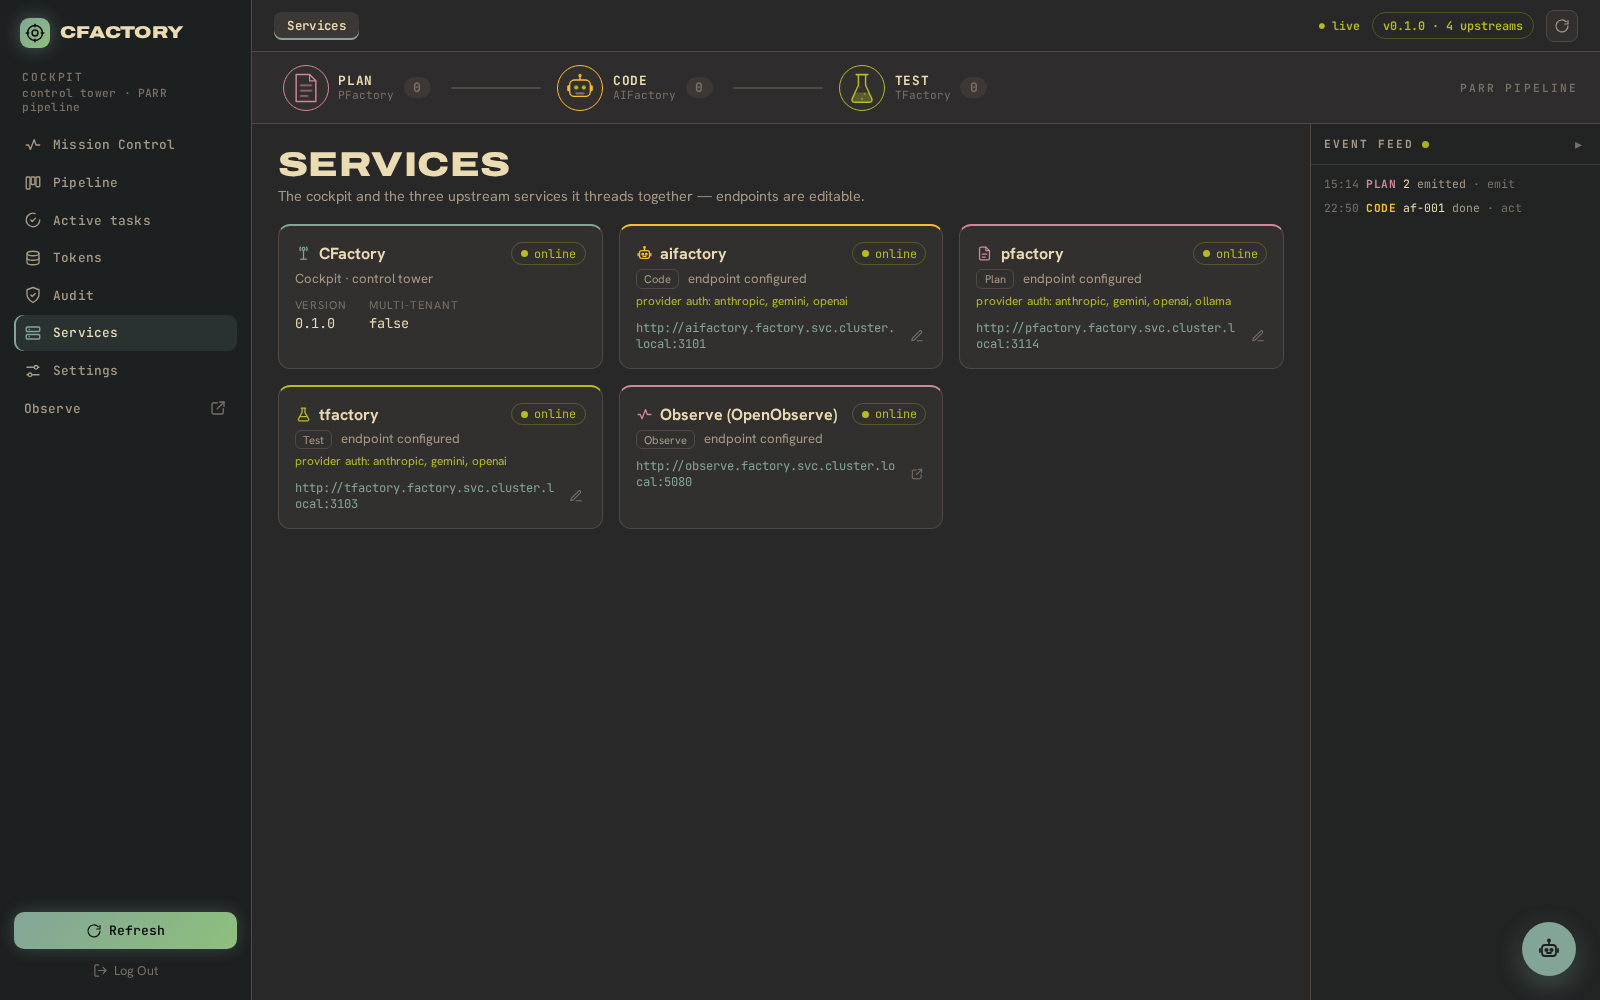
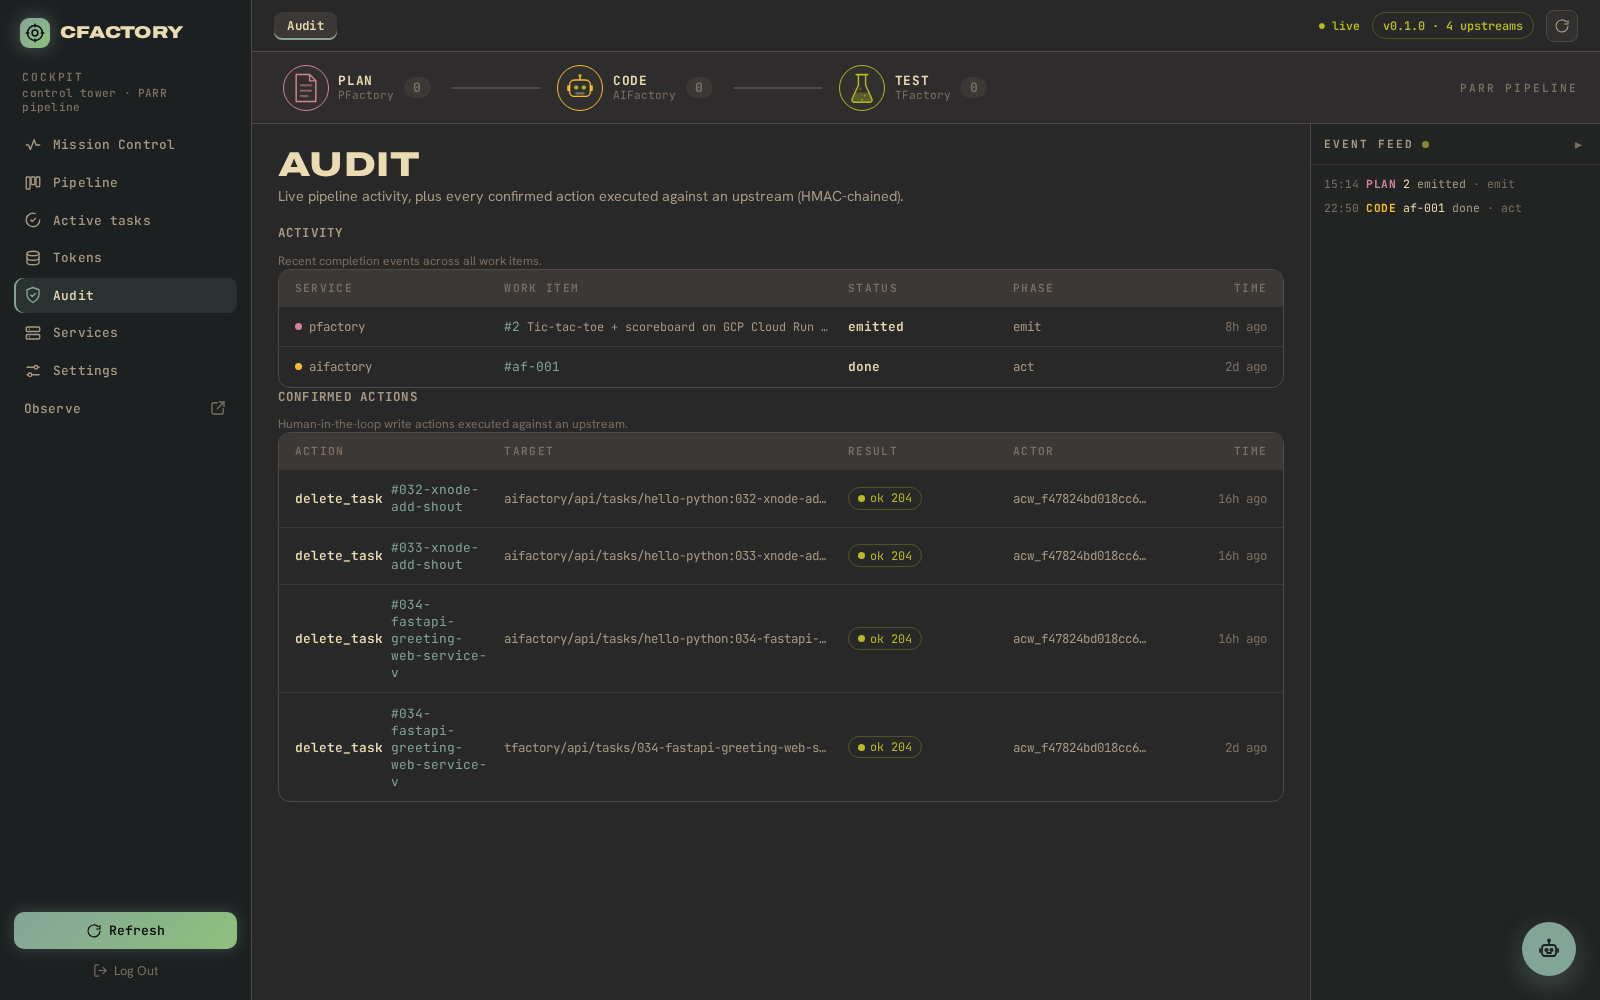
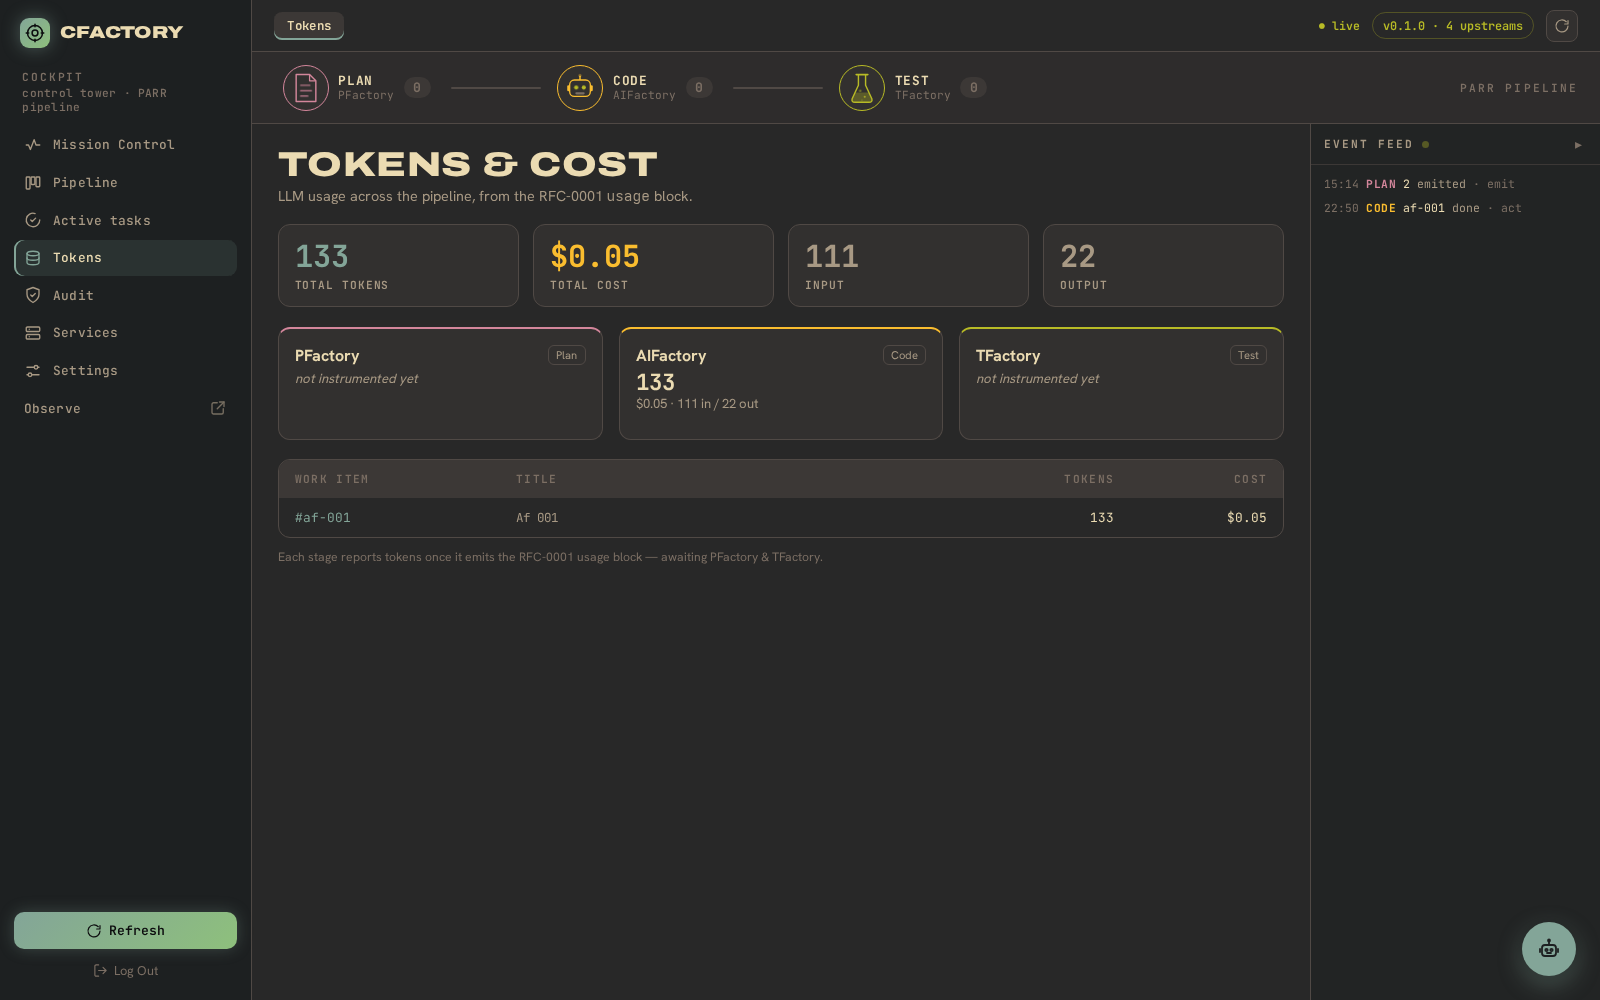
An agentic copilot explains pipeline state from real cross-service data and proposes actions — but a human always confirms. Every confirmed write is recorded in an HMAC-chained audit log, and token spend is tracked across the whole pipeline. As a consumer of the completion event, the cockpit also enforces the RFC-0001a evidence gates: a terminal “passed” that carries no proof (a zero-token build, a verify with a null verdict) is rendered as unproven, never green.
Live execution diagrams — one map per unit of work
Click any plan, coding, or testing task and the task-detail view opens an
animated dependency graph (DAG) of that work. It renders whichever stage is
furthest along — test, then code, then plan — from a shared graph field on
GET /api/workitems/{key}/process. Nodes light up as workers pick them up
(active pulse), fill green with a robot stamp when done, shake red on failure,
and go amber when stalled; the edge to the next eligible node animates so “what
runs next” is unmistakable, and each node shows live mm:ss time spent. The
producers feed it directly: AIFactory exposes per-subtask depends_on and
timing for the code stage, TFactory exposes per-subtask lane and timing for a
lane pipeline (unit → browser → api → integration → mutation), and PFactory’s
epic.children DAG drives the plan view. The renderer is hand-rolled SVG plus
framer-motion in the cockpit’s own gruvbox language — no graph library. See the
live execution diagrams design
(shipped v1).
Watch the build cost accrue, live
The cockpit now carries a live per-task cost stamp with a ticking graph — you watch a build’s cost rise in real time as its workers report in, then drill down per worker to see which provider and model spent what. AIFactory already ran heterogeneous parallel coders (Claude, Gemini, Ollama); the cockpit makes that parallelism visible and accountable. For the fleet-wide view, a link takes you straight to OpenObserve — bundled as the OTLP backend behind CFactory’s own ingress (Keycloak SSO + Cloudflare tunnel), so the cockpit stays the one pane of glass without growing a time-series database of its own.